Since the Time Management Questionnaire is a new instrument used for this study, some reliability and validity tests are warranted to determine a level of confidence to place in this instrument.
A Cronbach’s Alpha score was computed on the 11 items making up the “Time Management Survey”. The reliability of this scale was found to be 0.351 which is a very low reliability score. An inter-item correlation of the 11 questions was then computed to see if any of the scale questions were related to each other.
Table 1: Time Management Survey Inter-Item Correlation Matrix
|
|
Q2 |
Q3 |
Q4 |
Q5 |
Q6 |
Q7 |
Q8 |
Q9 |
Q10 |
Q11 |
|
Q1 |
-.029 |
-.091 |
.106 |
.349 |
.306 |
-.317 |
.142 |
-.153 |
.067 |
.427 |
|
Q2 |
|
.567 |
-.265 |
-.049 |
-.357 |
.068 |
-.451 |
.226 |
.402 |
.013 |
|
Q3 |
|
|
-.230 |
-.059 |
.110 |
.265 |
-.165 |
.166 |
.421 |
.133 |
|
Q4 |
|
|
|
.077 |
.124 |
.007 |
.106 |
.060 |
.081 |
.157 |
|
Q5 |
|
|
|
|
.256 |
-.308 |
.105 |
-.290 |
.019 |
.159 |
|
Q6 |
|
|
|
|
|
-.293 |
.333 |
-.292 |
-.049 |
.310 |
|
Q7 |
|
|
|
|
|
|
-.226 |
.379 |
.256 |
.020 |
|
Q8 |
|
|
|
|
|
|
|
-.222 |
-.444 |
.281 |
|
Q9 |
|
|
|
|
|
|
|
|
.031 |
.231 |
|
Q10 |
|
|
|
|
|
|
|
|
|
-.150 |
A Spearman correlation was also conducted between the 11 questions and student’s academic performance (Table 2). None of the 11 survey questions seem to correlate with academic performance.
Table 2: Spearman correlation between Time Management Survey Questions and Academic Performance
|
|
|
Exam 1 |
Cumm. Perf |
|
Q1 |
Correlation Coefficient |
-.135 |
.053 |
|
|
Sig. (2-tailed) |
.439 |
.763 |
|
Q2 |
Correlation Coefficient |
.150 |
-.024 |
|
|
Sig. (2-tailed) |
.390 |
.890 |
|
Q3 |
Correlation Coefficient |
.113 |
-.080 |
|
|
Sig. (2-tailed) |
.517 |
.646 |
|
Q4 |
Correlation Coefficient |
-.187 |
-.168 |
|
|
Sig. (2-tailed) |
.283 |
.335 |
|
Q5 |
Correlation Coefficient |
-.035 |
-.007 |
|
|
Sig. (2-tailed) |
.842 |
.967 |
|
Q6 |
Correlation Coefficient |
-.149 |
-.145 |
|
|
Sig. (2-tailed) |
.394 |
.406 |
|
Q7 |
Correlation Coefficient |
.011 |
.017 |
|
|
Sig. (2-tailed) |
.952 |
.923 |
|
Q8 |
Correlation Coefficient |
-.173 |
-.085 |
|
|
Sig. (2-tailed) |
.319 |
.625 |
|
Q9 |
Correlation Coefficient |
.321 |
.286 |
|
|
Sig. (2-tailed) |
.060 |
.096 |
|
Q10 |
Correlation Coefficient |
.020 |
-.011 |
|
|
Sig. (2-tailed) |
.909 |
.951 |
|
Q11 |
Correlation Coefficient |
-.017 |
-.048 |
|
|
Sig. (2-tailed) |
.921 |
.783 |
Next, the students’ estimates of the amount of time they spent on various recreational activities were compared to the time management scale using a Spearman coefficient matrix. Although it was expected that students with a low score on the Time Management Survey would spend a greater proportion of their time on recreational activities, no significance was found between these two dimensions (Table 3).
Table 3: Correlation of self-estimates of recreational activities and self assessment of time management skills
|
|
|
Plea-sure Reading |
Watching TV |
Time with Friends |
Chatting on-line |
Computer Games |
Console Games |
Social Networking |
Surfing Internet |
Shopping |
Volunteering |
Total Recreation Time |
Time Management Scale |
|
Exercising |
Corr. Coef. |
.482(**) |
.053 |
.255 |
.108 |
.068 |
.157 |
.172 |
.052 |
-.166 |
-.239 |
.422(*) |
-.166 |
|
Sig. (2-tailed) |
.002 |
.380 |
.139 |
.538 |
.698 |
.368 |
.324 |
.765 |
.339 |
.167 |
.012 |
.339 |
|
|
Pleasure Reading |
Corr. Coef. |
|
-.153 |
.309 |
.200 |
.091 |
.026 |
-.189 |
.049 |
-.278 |
.048 |
.517(**) |
.000 |
|
Sig. (2-tailed) |
|
.380 |
.071 |
.249 |
.602 |
.881 |
.277 |
.780 |
.106 |
.783 |
.001 |
.998 |
|
|
Watching TV |
Corr. Coef. |
|
|
.137 |
.166 |
.116 |
.234 |
.475(**) |
.021 |
-.188 |
-.279 |
.218 |
-.321 |
|
Sig. (2-tailed) |
|
|
.433 |
.340 |
.508 |
.175 |
.004 |
.904 |
.279 |
.104 |
.209 |
.060 |
|
|
Time with Friends |
Corr. Coef. |
|
|
|
.082 |
.085 |
.021 |
.122 |
.215 |
-.407(*) |
-.042 |
.511(**) |
-.115 |
|
Sig. (2-tailed) |
|
|
|
.638 |
.629 |
.906 |
.487 |
.214 |
.015 |
.813 |
.002 |
.509 |
|
|
Chatting on-line |
Corr. Coef. |
|
|
|
|
.271 |
.142 |
.240 |
.027 |
-.115 |
.137 |
.510(**) |
-.069 |
|
Sig. (2-tailed) |
|
|
|
|
.115 |
.417 |
.165 |
.880 |
.509 |
.433 |
.002 |
.693 |
|
|
Computer Games |
Corr. Coef. |
|
|
|
|
|
.179 |
.070 |
-.229 |
.123 |
-.262 |
.368(*) |
-.245 |
|
Sig. (2-tailed) |
|
|
|
|
|
.304 |
.689 |
.185 |
.481 |
.129 |
.029 |
.157 |
|
|
Console Games |
Corr. Coef. |
|
|
|
|
|
|
.271 |
-.032 |
.218 |
-.338(*) |
.367(*) |
-.271 |
|
Sig. (2-tailed) |
|
|
|
|
|
|
.115 |
.857 |
.209 |
.047 |
.030 |
.116 |
|
|
Social Networking |
Corr. Coef. |
|
|
|
|
|
|
|
.138 |
-.155 |
-.176 |
.291 |
-.238 |
|
Sig. (2-tailed) |
|
|
|
|
|
|
|
.428 |
.375 |
.312 |
.090 |
.169 |
|
|
Surfing Internet |
Corr. Coef. |
|
|
|
|
|
|
|
|
-.224 |
-.062 |
.417(*) |
-.113 |
|
Sig. (2-tailed) |
|
|
|
|
|
|
|
|
.195 |
.725 |
.013 |
.518 |
|
|
Shopping |
Corr. Coef. |
|
|
|
|
|
|
|
|
|
-.119 |
-.224 |
-.050 |
|
Sig. (2-tailed) |
|
|
|
|
|
|
|
|
|
.498 |
.195 |
.776 |
|
|
Volunteering |
Corr. Coef. |
|
|
|
|
|
|
|
|
|
|
-.198 |
.323 |
|
Sig. (2-tailed) |
|
|
|
|
|
|
|
|
|
|
.255 |
.059 |
|
|
Total Recreation Time |
Corr. Coef. |
|
|
|
|
|
|
|
|
|
|
|
-.286 |
|
Sig. (2-tailed) |
|
|
|
|
|
|
|
|
|
|
. |
.096 |
|
|
** Correlation is significant at the 0.01 level (2-tailed). * Correlation is significant at the 0.05 level (2-tailed). |
|||||||||||||
Turning our attention to testing the proposed hypotheses, a Pearson Product Coefficient was calculated between each of the BFI indicators and academic performance (Table 4). Conscientiousness was the only scale to show a significance (p<0.05)—albeit a negative one—when correlated with the first midterm exam. However, this correlation was less significant when Conscientiousness was compared with academic performance over the entire semester (p@0.06).
In analyzing whether learning styles as measured by the ILS can predict academic performance, there appeared to be no significance at all (Table 5).
Table 4: Pearson product coefficients between BFI factors and performance on the first midterm and cumulative academic performance
|
|
Exam #1 |
Academic Performance |
|
|
Extraversion |
Pearson Correlation |
-.201 |
-.026 |
|
|
Sig. (2-tailed) |
.247 |
.882 |
|
Agreeableness |
Pearson Correlation |
-.184 |
-.202 |
|
|
Sig. (2-tailed) |
.291 |
.245 |
|
Conscientiousness |
Pearson Correlation |
-.374(*) |
-.321 |
|
|
Sig. (2-tailed) |
.027 |
.060 |
|
Neuroticism |
Pearson Correlation |
-.023 |
-.087 |
|
|
Sig. (2-tailed) |
.896 |
.621 |
|
Openness |
Pearson Correlation |
-.057 |
-.091 |
|
|
Sig. (2-tailed) |
.747 |
.603 |
|
Exam #1 |
Pearson Correlation |
|
.856(**) |
|
|
Sig. (2-tailed) |
|
.000 |
|
* Correlation is significant at the 0.05 level (2-tailed). ** Correlation is significant at the 0.01 level (2-tailed). |
|||
Table 5: Pearson product coefficients comparing ILS styles with academic performance
|
ILS Style |
|
Academic Performance |
|
|
ACT |
Pearson Correlation |
-.190 |
|
|
|
Sig. (2-tailed) |
.275 |
|
|
REF |
Pearson Correlation |
.186 |
|
|
|
Sig. (2-tailed) |
.284 |
|
|
SNS |
Pearson Correlation |
-.101 |
|
|
|
Sig. (2-tailed) |
.563 |
|
|
INT |
Pearson Correlation |
.101 |
|
|
|
Sig. (2-tailed) |
.563 |
|
|
VIS |
Pearson Correlation |
-.117 |
|
|
|
Sig. (2-tailed) |
.505 |
|
|
VRB |
Pearson Correlation |
.117 |
|
|
|
Sig. (2-tailed) |
.505 |
|
|
SEQ |
Pearson Correlation |
-.193 |
|
|
|
Sig. (2-tailed) |
.268 |
|
|
GLO |
Pearson Correlation |
.193 |
|
|
|
Sig. (2-tailed) |
.268 |
|
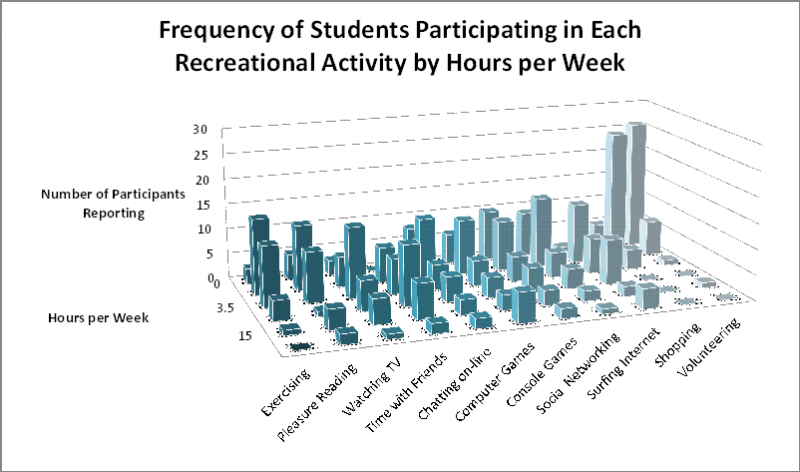
Students’ self-assessment of time management practices and ability was also compared to academic performance. This analysis involved two phases. In the first phase, the participants’ assessment of their own time-management skills and abilities as measured from the first 11 questions were correlated to their academic performance. However, this relationship was not found to be significant (-.146, p=0.403). In the second phase, participants’ estimates of the time they spent on a variety of recreational activities were also collected. A frequency chart showing the number of students who reported engaging in the different activities is shown in Figure 1. This chart compares the median values of time spent per week for each activity with the number of students reporting that value.
Figure 1: Frequency of students participating in various recreational activities by hours spent per week in each activity.
The time spent by each student on each recreational activity was then correlated with academic performance (Table 6). A positive correlation was found between time spent playing computer games and academic performance; however, no other recreational activities appeared to correlate with exam results.
Table 6: Spearman rho correlations between participants' estimates of time spent on recreational activities and academic performance
|
Recreational Activities |
Exam #1 |
Academic Performance |
|
|
Total Recreation Time |
Correlation Coefficient |
.193 |
.103 |
|
|
Sig. (2-tailed) |
.266 |
.558 |
|
Exercising |
Correlation Coefficient |
-.141 |
-.213 |
|
|
Sig. (2-tailed) |
.419 |
.219 |
|
Pleasure Reading |
Correlation Coefficient |
.158 |
.208 |
|
|
Sig. (2-tailed) |
.365 |
.231 |
|
Watching TV |
Correlation Coefficient |
.038 |
.000 |
|
|
Sig. (2-tailed) |
.829 |
.999 |
|
Time with Friends |
Correlation Coefficient |
.098 |
.084 |
|
|
Sig. (2-tailed) |
.576 |
.632 |
|
Chatting on-line |
Correlation Coefficient |
-.231 |
-.302 |
|
|
Sig. (2-tailed) |
.183 |
.078 |
|
Computer Games |
Correlation Coefficient |
.447(**) |
.319 |
|
|
Sig. (2-tailed) |
.007 |
.062 |
|
Console Games |
Correlation Coefficient |
.084 |
-.109 |
|
|
Sig. (2-tailed) |
.633 |
.532 |
|
Social Networking |
Correlation Coefficient |
-.198 |
-.325 |
|
|
Sig. (2-tailed) |
.254 |
.057 |
|
Surfing Internet |
Correlation Coefficient |
.126 |
-.001 |
|
|
Sig. (2-tailed) |
.470 |
.995 |
|
Shopping |
Correlation Coefficient |
.144 |
.166 |
|
|
Sig. (2-tailed) |
.408 |
.342 |
|
Volunteering |
Correlation Coefficient |
-.112 |
-.061 |
|
|
Sig. (2-tailed) |
.524 |
.728 |
|
* Correlation is significant at the 0.05 level (2-tailed). ** Correlation is significant at the 0.01 level (2-tailed). |
|||
Of the questions posed in the problem solving and logical thinking portion of the pre-study instrument, questions 11 and 9 (p≤0.01), as well as questions 7, 12 and 4 (p≤0.05) showed the strongest correlations with academic performance (Table 7). Conversely, problems 1 and 8, 2, 3, 5 and 10 showed almost no correlation at all.
Table 7: Spearman Rho Correlation Matrix between Problem Solving Questions and Academic Performance
|
|
|
Problem 2 |
Problem 3 |
Problem 4 |
Problem 5 |
Problem 6 |
Problem 7 |
Problem 9 |
Problem 10 |
Problem 11 |
Problem 12 |
Academic Performance |
|
Problems 1 & 8 |
Correlation Coefficient |
.180 |
.240 |
.377(*) |
.049 |
.147 |
.103 |
.165 |
-.196 |
.053 |
-.094 |
-.097 |
|
|
Sig. (1-tailed) |
.150 |
.082 |
.013 |
.391 |
.200 |
.279 |
.172 |
.129 |
.380 |
.295 |
.289 |
|
Problem 2 |
Correlation Coefficient |
|
-.125 |
-.059 |
.111 |
-.076 |
-.053 |
-.232 |
-.153 |
-.167 |
.139 |
.000 |
|
|
Sig. (1-tailed) |
|
.237 |
.368 |
.263 |
.332 |
.380 |
.090 |
.190 |
.169 |
.212 |
.500 |
|
Problem 3 |
Correlation Coefficient |
|
|
.141 |
.257 |
.249 |
.240 |
.101 |
.000 |
.000 |
.186 |
.202 |
|
|
Sig. (1-tailed) |
|
|
.209 |
.068 |
.075 |
.082 |
.283 |
.500 |
.500 |
.143 |
.122 |
|
Problem 4 |
Correlation Coefficient |
|
|
|
.083 |
-.061 |
.245 |
.586(**) |
-.144 |
.354(*) |
-.066 |
.320(*) |
|
|
Sig. (1-tailed) |
|
|
|
.319 |
.364 |
.078 |
.000 |
.204 |
.019 |
.354 |
.030 |
|
Problem 5 |
Correlation Coefficient |
|
|
|
|
.117 |
.310(*) |
.042 |
-.200 |
.093 |
.139 |
.136 |
|
|
Sig. (1-tailed) |
|
|
|
|
.251 |
.035 |
.405 |
.125 |
.297 |
.213 |
.218 |
|
Problem 6 |
Correlation Coefficient |
|
|
|
|
|
.260 |
-.061 |
.307(*) |
.298(*) |
.245 |
.273 |
|
|
Sig. (1-tailed) |
|
|
|
|
|
.065 |
.363 |
.036 |
.041 |
.078 |
.056 |
|
Problem 7 |
Correlation Coefficient |
|
|
|
|
|
|
.447(**) |
.131 |
.187 |
.253 |
.388(*) |
|
|
Sig. (1-tailed) |
|
|
|
|
|
|
.004 |
.227 |
.141 |
.071 |
.011 |
|
Problem 9 |
Correlation Coefficient |
|
|
|
|
|
|
|
-.123 |
.452(**) |
.182 |
.481(**) |
|
|
Sig. (1-tailed) |
|
|
|
|
|
|
|
.241 |
.003 |
.148 |
.002 |
|
Problem 10 |
Correlation Coefficient |
|
|
|
|
|
|
|
|
.117 |
.038 |
.014 |
|
|
Sig. (1-tailed) |
|
|
|
|
|
|
|
|
.252 |
.414 |
.468 |
|
Problem 11 |
Correlation Coefficient |
|
|
|
|
|
|
|
|
|
.248 |
.531(**) |
|
|
Sig. (1-tailed) |
|
|
|
|
|
|
|
|
|
.076 |
.001 |
|
Problem 12 |
Correlation Coefficient |
|
|
|
|
|
|
|
|
|
|
.345(*) |
|
|
Sig. (1-tailed) |
|
|
|
|
|
|
|
|
|
|
.021 |
* Correlation is significant at the 0.05 level (1-tailed).
** Correlation is significant at the 0.01 level (1-tailed).
Links
[1] https://niedermayer.ca/user/login?destination=node/110%23comment-form
[2] https://niedermayer.ca/user/login?destination=node/111%23comment-form
[3] https://niedermayer.ca/user/login?destination=node/112%23comment-form
[4] https://niedermayer.ca/user/login?destination=node/113%23comment-form