There is currently a shortage of graduates from Computer Science and Information Technology programs to meet industry demands, yet these programs have a difficult time recruiting and retaining students. Attrition in some programs range from 50 to 85% of those students who first enter. Prior studies indicate that personality attributes, learning styles, time management skills and logical thinking abilities may all be valid predictors of those students who are likely to be successful in studying computer science. The present study used a first year computer programming class to collect data on these variables at the start of the semester and then compared them with the students’ academic result at the conclusion of the course. The study found that personality attributes, learning style, and time management skills were poor predictors of future success in computer programming. However, certain groups of logical problems, particularly those requiring cognitive modeling of the problem, disjunctive logic and deductive and rule based reasoning can serve as future predictors of success in this field. These results can be used to create an admissions test for students considering studying computer science and suggest modifications to educational curricula within the primary and secondary school systems.
Keywords: Information Technology, Computer Science, programming, software development, logic, problem solving, time management, learning styles, personality traits, education
The number of new graduates entering the Information and Communications Technology (ICT) industry is becoming a critical issue in our economy. At present, this number is insufficient to meet industry requirements (Information and Communications Technology Council, 2008). This shortage of graduates can be attributed to a number of factors, one of which is the ability of schools of computer science and information technology to attract and retain new students. Often, students enrolling in these programs drop out due to academic reasons. Therefore a need exists to identify those factors which correlate with academic performance among ICT graduates. These factors could then be used to “pre-screen” those students interested in a career in information technology. Such a prescreening would help students self-reflect on whether a career in ICT is suitable for them before committing the financial and emotional resources and time in undertaking a course of study for which they may not be suited. At the same time, such a tool could help other students who had not considered an ICT career to quickly determine whether they share qualities typical of ICT graduates.
The Information and Communications Technology Council (ICTC), the federal industry labour force advisory panel for ICT, predicts skills shortages across the country and actual labour shortages in Western Canada through 2015. In 2007, the economy added approximately 16,800 ICT jobs—ahead of the forecasted 14,500. In the first half of 2008, a further 4,200 jobs were added. In its 2008 forecast, the ICTC predicts net job growth plus replacement for retiring workers will require 15,795 to 22,345 jobs per year (Information and Communications Technology Council, 2008). Yet, across Canada, enrollment in post-secondary computer science programs is in a prolonged decline with enrollment numbers down 33% from their 2001-2002 peak (Information and Communications Technology Council, 2008). Within Atlantic Canada, enrollments are down 37% from their 2001-2002 levels. Ontario and Quebec are between 50-60% of their 2001-2002 levels. Enrollment across the Prairies is at 65% of its peak. Only British Columbia has maintained enrollment in Computer Science (CS) program, maintaining 97% of its 2001-2002 level. Baccalaureate graduation numbers across the country have declined from 4,900 in 2003-2004 to 3,300 in 2006-2007 and have continued to decline (Slonim, Scully, & McAlliser, 2008).
Significant issues are emerging about how to successfully teach computer programming at the pos-secondary level in North America. Slonim, Scully, and McAllister (2008) observed that Computer Science (CS) programs in North America typically have a low retention rate from first to second year. Instructors teaching in the disciplines of Information Technology and Computer Science (IT/CS) frequently lament that some students just can’t seem to grasp the necessary skills to be successful in their studies. David LeBlanc, Chair of the Computer Science Department at UPEI states that only 12-25% of students entering his program will graduate; Holland College, also in PEI, expects to lose 50% of its information technology students between the first and second years (Canadian Broadcasting Corporation, 2010). This statistic is also validated by the retention rate within the Computer Information Technology program at Lethbridge College. Often IT students seem to have an inability to understand the logic, process and methodology behind algorithmic development—a foundational topic in the field of information technology (Thomas, Ratcliffe, Woodburry, & Jarman, 2002).
Given the time and cost of educating a post-secondary student, the current state of affairs seems like an inefficient use of resources by both the student and the institution. Therefore, is it possible to identify those factors which correlate with student success in computer science and information technology programs? And if so, what are these factors? In attempting to isolate factors that can predict success in IT/CS studies, a survey of available literature points to four areas that show promising results:
The question of how to operationally define motivation is not trivial. Le, Casillas, Robbins and Langley (2005) developed the Student Readiness Inventory or SRI to provide metrics on the personality dimensions most relevant to post-secondary academic success. They found that conscientiousness, goal-focus, and academic self-confidence are the strongest components of academic motivation (Le, Casillas, Robbins, & Langley, 2005). Using another measure, the Big Five Inventory or BFI, Komarraju and Karau (2005) found that the BFI’s conscientiousness scale strongly correlated with academic motivation. In independent confirmation of this finding, Peterson, Casillas and Robbins (2006) found strong correlation between the Conscientious scale of the Big Five Inventory (BFI) and motivation as measured by the Student Readiness Inventory (SRI).
It a study of almost 4,000 students from 28 different institutions offering both two- and four-year programs, and including subjects from a wide variety of disciplines, Allen and Robbins (2010) tried to correlate “interest-major” congruence, motivation as measured by the SRI, and first-year performance as predictors of students’ completion of their studies within each program’s nominal duration, which they use as their operational definition of achievement. They found that only 12% of students in a two-year program completed their studies in the nominal period. Among students taking a two-year program, only motivation was significant and even then, only indirectly. While motivation did not directly correlate to achievement, it did correlate with first-year performance and first-year performance did correlate with achievement (Allen & Robbins, 2010).
In another study of why students underachieve, Balduf (2009) looked at individual study skills. She reported that nearly all students—even those with strong high school grades—reported that “high school did not require them to work hard enough and felt that they earned high grades without expending much effort” (2009, p. 284). Her research found that many students enter post-secondary programs without effective study skills or adequate time management abilities and that students were externally motivated (eg. looking for grades or parental rewards) rather than being internally motivated (eg. seeking understanding, understanding, or integration of various knowledge domains). She reports that students also found that the amount of freedom in post-secondary institutions was an additional challenge to their time management skills.
A more robust study of time management and student success used a combination of GPA results and a set of questionnaires administered to both the participants and a friend of each participant. This study found that time management skills, intelligence, time spent studying, waking up earlier, owning a computer, spending less time in passive leisure, and eating a healthy diet were all significant predictors of positive GPA results (George, Dixon, Stansal, Gelb, & Pheri, 2008).
Studies have also been conducted to determine if there is any relationship between students’ learning style and their success in learning particular programming languages (Thomas, Ratcliffe, Woodburry, & Jarman, 2002). Similar research on how students can best learn computer programming languages have focused on what are the best teaching styles to complement the various learning styles of students (Bayman & Mayer, 1988). Learning styles have been measured using the Myers-Briggs Type Indicator (MBTI), the Index of Learning Styles (ILS) Questionnaire (Soloman & Felder, 2009), and the Gregorc Style Delineator (GSD) (Gregorc, 1984).
Using the ILS, Thomas et al. (2002) found that reflective learners were better programmers than active learners, and verbal learners had higher scores than visual learners (2002). Davidson and Saveyne (1992), using the GSD found that abstract sequential mindsets correlate with a better ability to learn a programming language than other mindsets while those with abstract random mindsets have a negative correlation. There was no correlation among those students with a concrete learning style.
Another avenue of inquiry has recently started to look at the specific problems encountered by students in IT/CS programs. Students in these courses often encounter a level of abstraction in their subject matter unfamiliar to students in many other disciplines. Forming algorithms to solve computational problems often involves a number of different types of logical processing within the same problem space. Definitions in this knowledge domain often involve negation with conditional conjunction or disjunction. An example could be the definition of a “ball” in North American baseball: “A pitch at which the batter does not swing and which does not pass through the strike zone” (Goodwin & Johnson-Laird, 2010). For those familiar with the game, this definition seems self-evident, but for a person learning new skills (such as programming), the logic to conceptualize such an abstract concept can be daunting. Similarly, the definition that “x owns y” means that (in part), “it is permissible for x to use y, and not permissible for others to prevent x from using y” (Goodwin & Johnson-Laird, 2010).
Goodwin and Johnson-Laird hypothesize that people form mental models of these Boolean expressions that are not often correct in their logical representations. They found that people generally have a difficult time considering all the possibilities of such Boolean paradigms.
Stanovich (2002) argues that cognitive capacity (such as the ability to do well on an IQ test) is distinct from a person’s thinking disposition—a term that he uses to refer to the intersection of cognitive ability or intelligence, and personality traits such as will, desire and behaviour. Stanovich (2002) then suggests that “thinking dispositions can predict performance on reasoning and rational thinking tasks even after individual differences in measures of general cognitive ability have been partialled [sic] out” (p. 131). One type of thinking disposition, which Toplak and Stanovich (2002) call disjunctive reasoning or “as the tendency to consider all possible states of the world when deciding among options or when choosing a problem solution in a reasoning task” (p. 197), may be significant in identifying those people who can process complex logical problems. In a study involving nine disjunctive logic problems, a number of the problems tested generalized disjunctive thinking dispositions and these test items show a stronger association with thinking styles (or dispositions) than with cognitive ability and capacity, thus strengthening the argument in favour of a differentiation between the two constructs (Toplak & Stanovich, 2002).
A sub-type of complex reasoning problems known as “Analytical Reasoning” problems, have until recently been part of the Graduate Record Examination (GRE), an entrance test widely used for candidates to graduate schools throughout Europe and North America. They remain part of the Law School Admission Test (LSAT) and discussions are on-going about resurrecting their use in the GRE (Newstead, Bradon, Handley, Dennis, & Evans, 2006). In this class of problem, a narrative of the scenario contains the initial context and a list of the rules allowed in the problem space. The subject is then presented with a list of questions or problems. Successfully arriving at the solution involves a deep semantic understanding of the scenario and the ability to parse out the embedded rules. Only then can the subject start to solve the problem. Problem solving involves identifying which rule to apply first in order to reduce the number of possible options in the solution set as quickly as possible.
In this experiment, an incoming first-year class of Computer Information Technology (CIT) students were administered a survey assessing them on a number of independent variables including personality traits, learning styles, time management and logical problem solving ability. The results of this survey were then compared with the dependent variable as measured by the students’ actual academic performance during their first semester of an introductory course in computer programming.
49 first year CIT students were enrolled at the start of the fall 2010 semester at Lethbridge College in Lethbridge, Alberta, Canada. Of these students, 43 agreed to participate in the study, an 87% response rate. By the time the first major or midterm exam was conducted in late October, 35 students remained enrolled in the course and wrote the exam. Only 27 students remained in the course to write the second midterm and final exam.
Of the students participating in this study, 2 were female; only 1 of which completed the course. The average age of the participants was 24 years, with the oldest being 50 years old and the youngest being 18.
The pre-test instrument included:
The BFI was used because it is a shorter instrument comprising only 44 questions, and is freely available for non-commercial use. Its use by Allen and Robbins has been shown to correlate with measures of student motivation as measured by the SRI.
The ILS was selected because it is developed from a composite of learning models, namely the Myers-Briggs Type Indicator (MBTI), Kolb’s Learning Style Model and the Herrmann Brain Dominance Instrument (Thomas, Ratcliffe, Woodburry, & Jarman, 2002). It is free of charge and is administered as a web application with immediate scoring.
A review of available literature found no suitable questionnaire or other instrument to measure the time management practices or recreational activities of post-secondary students. For this reason, a series of 22 questions were developed to determine if time management and the allocation of recreational time by students can provide any prediction of their academic success. These questions and the range of responses is listed in Appendix A.
Problem solving ability was measured using a series of questions proposed by Toplak and Stanovich (2002) and augmented by some less demanding questions proposed by Frederick (2005). One analytical reasoning question (Newstead, Bradon, Handley, Dennis, & Evans, 2006) was also included in an attempt to give this factor a wide spectrum for assessment. The text of these questions is found in Appendix B.
[1] The BFI is copyright 1991 by Oliver Johns. It is used with permission.
[2] The ILS is copyright 1991 and 1994 by North Carolina State University and authored by Richard M. Felder and Barbara A. Soloman. It is and used with permission.
Following an introduction to the study and the solicitation of informed consent from participants, the pre-study instrument was provided to students in early September. Students completed the survey during a regular class period.
The evaluations were graded as follows:
As part of their regular course work, students completed three major exams during the semester; these exams and the final exam grade were then compared to the responses from the pre-study survey. Students who dropped the class prior to completing the first exam were excluded from the study. A cumulative performance score composed of the average of all exams completed by a student was also calculated.
Since the Time Management Questionnaire is a new instrument used for this study, some reliability and validity tests are warranted to determine a level of confidence to place in this instrument.
A Cronbach’s Alpha score was computed on the 11 items making up the “Time Management Survey”. The reliability of this scale was found to be 0.351 which is a very low reliability score. An inter-item correlation of the 11 questions was then computed to see if any of the scale questions were related to each other.
Table 1: Time Management Survey Inter-Item Correlation Matrix
|
|
Q2 |
Q3 |
Q4 |
Q5 |
Q6 |
Q7 |
Q8 |
Q9 |
Q10 |
Q11 |
|
Q1 |
-.029 |
-.091 |
.106 |
.349 |
.306 |
-.317 |
.142 |
-.153 |
.067 |
.427 |
|
Q2 |
|
.567 |
-.265 |
-.049 |
-.357 |
.068 |
-.451 |
.226 |
.402 |
.013 |
|
Q3 |
|
|
-.230 |
-.059 |
.110 |
.265 |
-.165 |
.166 |
.421 |
.133 |
|
Q4 |
|
|
|
.077 |
.124 |
.007 |
.106 |
.060 |
.081 |
.157 |
|
Q5 |
|
|
|
|
.256 |
-.308 |
.105 |
-.290 |
.019 |
.159 |
|
Q6 |
|
|
|
|
|
-.293 |
.333 |
-.292 |
-.049 |
.310 |
|
Q7 |
|
|
|
|
|
|
-.226 |
.379 |
.256 |
.020 |
|
Q8 |
|
|
|
|
|
|
|
-.222 |
-.444 |
.281 |
|
Q9 |
|
|
|
|
|
|
|
|
.031 |
.231 |
|
Q10 |
|
|
|
|
|
|
|
|
|
-.150 |
A Spearman correlation was also conducted between the 11 questions and student’s academic performance (Table 2). None of the 11 survey questions seem to correlate with academic performance.
Table 2: Spearman correlation between Time Management Survey Questions and Academic Performance
|
|
|
Exam 1 |
Cumm. Perf |
|
Q1 |
Correlation Coefficient |
-.135 |
.053 |
|
|
Sig. (2-tailed) |
.439 |
.763 |
|
Q2 |
Correlation Coefficient |
.150 |
-.024 |
|
|
Sig. (2-tailed) |
.390 |
.890 |
|
Q3 |
Correlation Coefficient |
.113 |
-.080 |
|
|
Sig. (2-tailed) |
.517 |
.646 |
|
Q4 |
Correlation Coefficient |
-.187 |
-.168 |
|
|
Sig. (2-tailed) |
.283 |
.335 |
|
Q5 |
Correlation Coefficient |
-.035 |
-.007 |
|
|
Sig. (2-tailed) |
.842 |
.967 |
|
Q6 |
Correlation Coefficient |
-.149 |
-.145 |
|
|
Sig. (2-tailed) |
.394 |
.406 |
|
Q7 |
Correlation Coefficient |
.011 |
.017 |
|
|
Sig. (2-tailed) |
.952 |
.923 |
|
Q8 |
Correlation Coefficient |
-.173 |
-.085 |
|
|
Sig. (2-tailed) |
.319 |
.625 |
|
Q9 |
Correlation Coefficient |
.321 |
.286 |
|
|
Sig. (2-tailed) |
.060 |
.096 |
|
Q10 |
Correlation Coefficient |
.020 |
-.011 |
|
|
Sig. (2-tailed) |
.909 |
.951 |
|
Q11 |
Correlation Coefficient |
-.017 |
-.048 |
|
|
Sig. (2-tailed) |
.921 |
.783 |
Next, the students’ estimates of the amount of time they spent on various recreational activities were compared to the time management scale using a Spearman coefficient matrix. Although it was expected that students with a low score on the Time Management Survey would spend a greater proportion of their time on recreational activities, no significance was found between these two dimensions (Table 3).
Table 3: Correlation of self-estimates of recreational activities and self assessment of time management skills
|
|
|
Plea-sure Reading |
Watching TV |
Time with Friends |
Chatting on-line |
Computer Games |
Console Games |
Social Networking |
Surfing Internet |
Shopping |
Volunteering |
Total Recreation Time |
Time Management Scale |
|
Exercising |
Corr. Coef. |
.482(**) |
.053 |
.255 |
.108 |
.068 |
.157 |
.172 |
.052 |
-.166 |
-.239 |
.422(*) |
-.166 |
|
Sig. (2-tailed) |
.002 |
.380 |
.139 |
.538 |
.698 |
.368 |
.324 |
.765 |
.339 |
.167 |
.012 |
.339 |
|
|
Pleasure Reading |
Corr. Coef. |
|
-.153 |
.309 |
.200 |
.091 |
.026 |
-.189 |
.049 |
-.278 |
.048 |
.517(**) |
.000 |
|
Sig. (2-tailed) |
|
.380 |
.071 |
.249 |
.602 |
.881 |
.277 |
.780 |
.106 |
.783 |
.001 |
.998 |
|
|
Watching TV |
Corr. Coef. |
|
|
.137 |
.166 |
.116 |
.234 |
.475(**) |
.021 |
-.188 |
-.279 |
.218 |
-.321 |
|
Sig. (2-tailed) |
|
|
.433 |
.340 |
.508 |
.175 |
.004 |
.904 |
.279 |
.104 |
.209 |
.060 |
|
|
Time with Friends |
Corr. Coef. |
|
|
|
.082 |
.085 |
.021 |
.122 |
.215 |
-.407(*) |
-.042 |
.511(**) |
-.115 |
|
Sig. (2-tailed) |
|
|
|
.638 |
.629 |
.906 |
.487 |
.214 |
.015 |
.813 |
.002 |
.509 |
|
|
Chatting on-line |
Corr. Coef. |
|
|
|
|
.271 |
.142 |
.240 |
.027 |
-.115 |
.137 |
.510(**) |
-.069 |
|
Sig. (2-tailed) |
|
|
|
|
.115 |
.417 |
.165 |
.880 |
.509 |
.433 |
.002 |
.693 |
|
|
Computer Games |
Corr. Coef. |
|
|
|
|
|
.179 |
.070 |
-.229 |
.123 |
-.262 |
.368(*) |
-.245 |
|
Sig. (2-tailed) |
|
|
|
|
|
.304 |
.689 |
.185 |
.481 |
.129 |
.029 |
.157 |
|
|
Console Games |
Corr. Coef. |
|
|
|
|
|
|
.271 |
-.032 |
.218 |
-.338(*) |
.367(*) |
-.271 |
|
Sig. (2-tailed) |
|
|
|
|
|
|
.115 |
.857 |
.209 |
.047 |
.030 |
.116 |
|
|
Social Networking |
Corr. Coef. |
|
|
|
|
|
|
|
.138 |
-.155 |
-.176 |
.291 |
-.238 |
|
Sig. (2-tailed) |
|
|
|
|
|
|
|
.428 |
.375 |
.312 |
.090 |
.169 |
|
|
Surfing Internet |
Corr. Coef. |
|
|
|
|
|
|
|
|
-.224 |
-.062 |
.417(*) |
-.113 |
|
Sig. (2-tailed) |
|
|
|
|
|
|
|
|
.195 |
.725 |
.013 |
.518 |
|
|
Shopping |
Corr. Coef. |
|
|
|
|
|
|
|
|
|
-.119 |
-.224 |
-.050 |
|
Sig. (2-tailed) |
|
|
|
|
|
|
|
|
|
.498 |
.195 |
.776 |
|
|
Volunteering |
Corr. Coef. |
|
|
|
|
|
|
|
|
|
|
-.198 |
.323 |
|
Sig. (2-tailed) |
|
|
|
|
|
|
|
|
|
|
.255 |
.059 |
|
|
Total Recreation Time |
Corr. Coef. |
|
|
|
|
|
|
|
|
|
|
|
-.286 |
|
Sig. (2-tailed) |
|
|
|
|
|
|
|
|
|
|
. |
.096 |
|
|
** Correlation is significant at the 0.01 level (2-tailed). * Correlation is significant at the 0.05 level (2-tailed). |
|||||||||||||
Turning our attention to testing the proposed hypotheses, a Pearson Product Coefficient was calculated between each of the BFI indicators and academic performance (Table 4). Conscientiousness was the only scale to show a significance (p<0.05)—albeit a negative one—when correlated with the first midterm exam. However, this correlation was less significant when Conscientiousness was compared with academic performance over the entire semester (p@0.06).
In analyzing whether learning styles as measured by the ILS can predict academic performance, there appeared to be no significance at all (Table 5).
Table 4: Pearson product coefficients between BFI factors and performance on the first midterm and cumulative academic performance
|
|
Exam #1 |
Academic Performance |
|
|
Extraversion |
Pearson Correlation |
-.201 |
-.026 |
|
|
Sig. (2-tailed) |
.247 |
.882 |
|
Agreeableness |
Pearson Correlation |
-.184 |
-.202 |
|
|
Sig. (2-tailed) |
.291 |
.245 |
|
Conscientiousness |
Pearson Correlation |
-.374(*) |
-.321 |
|
|
Sig. (2-tailed) |
.027 |
.060 |
|
Neuroticism |
Pearson Correlation |
-.023 |
-.087 |
|
|
Sig. (2-tailed) |
.896 |
.621 |
|
Openness |
Pearson Correlation |
-.057 |
-.091 |
|
|
Sig. (2-tailed) |
.747 |
.603 |
|
Exam #1 |
Pearson Correlation |
|
.856(**) |
|
|
Sig. (2-tailed) |
|
.000 |
|
* Correlation is significant at the 0.05 level (2-tailed). ** Correlation is significant at the 0.01 level (2-tailed). |
|||
Table 5: Pearson product coefficients comparing ILS styles with academic performance
|
ILS Style |
|
Academic Performance |
|
|
ACT |
Pearson Correlation |
-.190 |
|
|
|
Sig. (2-tailed) |
.275 |
|
|
REF |
Pearson Correlation |
.186 |
|
|
|
Sig. (2-tailed) |
.284 |
|
|
SNS |
Pearson Correlation |
-.101 |
|
|
|
Sig. (2-tailed) |
.563 |
|
|
INT |
Pearson Correlation |
.101 |
|
|
|
Sig. (2-tailed) |
.563 |
|
|
VIS |
Pearson Correlation |
-.117 |
|
|
|
Sig. (2-tailed) |
.505 |
|
|
VRB |
Pearson Correlation |
.117 |
|
|
|
Sig. (2-tailed) |
.505 |
|
|
SEQ |
Pearson Correlation |
-.193 |
|
|
|
Sig. (2-tailed) |
.268 |
|
|
GLO |
Pearson Correlation |
.193 |
|
|
|
Sig. (2-tailed) |
.268 |
|
Students’ self-assessment of time management practices and ability was also compared to academic performance. This analysis involved two phases. In the first phase, the participants’ assessment of their own time-management skills and abilities as measured from the first 11 questions were correlated to their academic performance. However, this relationship was not found to be significant (-.146, p=0.403). In the second phase, participants’ estimates of the time they spent on a variety of recreational activities were also collected. A frequency chart showing the number of students who reported engaging in the different activities is shown in Figure 1. This chart compares the median values of time spent per week for each activity with the number of students reporting that value.
Figure 1: Frequency of students participating in various recreational activities by hours spent per week in each activity.
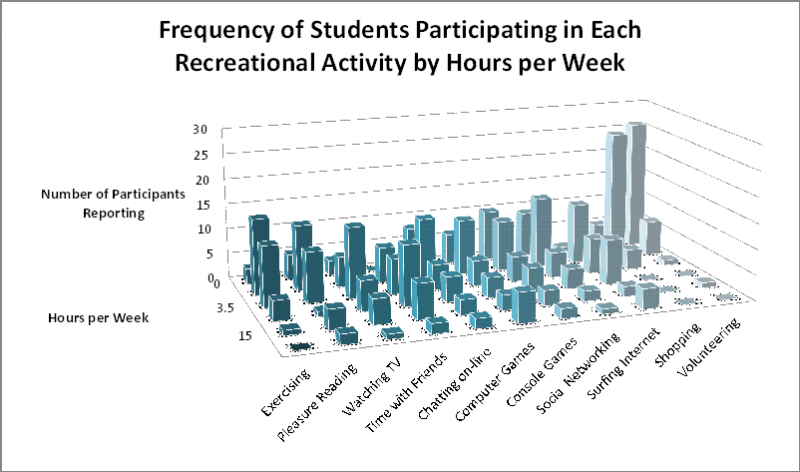
The time spent by each student on each recreational activity was then correlated with academic performance (Table 6). A positive correlation was found between time spent playing computer games and academic performance; however, no other recreational activities appeared to correlate with exam results.
Table 6: Spearman rho correlations between participants' estimates of time spent on recreational activities and academic performance
|
Recreational Activities |
Exam #1 |
Academic Performance |
|
|
Total Recreation Time |
Correlation Coefficient |
.193 |
.103 |
|
|
Sig. (2-tailed) |
.266 |
.558 |
|
Exercising |
Correlation Coefficient |
-.141 |
-.213 |
|
|
Sig. (2-tailed) |
.419 |
.219 |
|
Pleasure Reading |
Correlation Coefficient |
.158 |
.208 |
|
|
Sig. (2-tailed) |
.365 |
.231 |
|
Watching TV |
Correlation Coefficient |
.038 |
.000 |
|
|
Sig. (2-tailed) |
.829 |
.999 |
|
Time with Friends |
Correlation Coefficient |
.098 |
.084 |
|
|
Sig. (2-tailed) |
.576 |
.632 |
|
Chatting on-line |
Correlation Coefficient |
-.231 |
-.302 |
|
|
Sig. (2-tailed) |
.183 |
.078 |
|
Computer Games |
Correlation Coefficient |
.447(**) |
.319 |
|
|
Sig. (2-tailed) |
.007 |
.062 |
|
Console Games |
Correlation Coefficient |
.084 |
-.109 |
|
|
Sig. (2-tailed) |
.633 |
.532 |
|
Social Networking |
Correlation Coefficient |
-.198 |
-.325 |
|
|
Sig. (2-tailed) |
.254 |
.057 |
|
Surfing Internet |
Correlation Coefficient |
.126 |
-.001 |
|
|
Sig. (2-tailed) |
.470 |
.995 |
|
Shopping |
Correlation Coefficient |
.144 |
.166 |
|
|
Sig. (2-tailed) |
.408 |
.342 |
|
Volunteering |
Correlation Coefficient |
-.112 |
-.061 |
|
|
Sig. (2-tailed) |
.524 |
.728 |
|
* Correlation is significant at the 0.05 level (2-tailed). ** Correlation is significant at the 0.01 level (2-tailed). |
|||
Of the questions posed in the problem solving and logical thinking portion of the pre-study instrument, questions 11 and 9 (p≤0.01), as well as questions 7, 12 and 4 (p≤0.05) showed the strongest correlations with academic performance (Table 7). Conversely, problems 1 and 8, 2, 3, 5 and 10 showed almost no correlation at all.
Table 7: Spearman Rho Correlation Matrix between Problem Solving Questions and Academic Performance
|
|
|
Problem 2 |
Problem 3 |
Problem 4 |
Problem 5 |
Problem 6 |
Problem 7 |
Problem 9 |
Problem 10 |
Problem 11 |
Problem 12 |
Academic Performance |
|
Problems 1 & 8 |
Correlation Coefficient |
.180 |
.240 |
.377(*) |
.049 |
.147 |
.103 |
.165 |
-.196 |
.053 |
-.094 |
-.097 |
|
|
Sig. (1-tailed) |
.150 |
.082 |
.013 |
.391 |
.200 |
.279 |
.172 |
.129 |
.380 |
.295 |
.289 |
|
Problem 2 |
Correlation Coefficient |
|
-.125 |
-.059 |
.111 |
-.076 |
-.053 |
-.232 |
-.153 |
-.167 |
.139 |
.000 |
|
|
Sig. (1-tailed) |
|
.237 |
.368 |
.263 |
.332 |
.380 |
.090 |
.190 |
.169 |
.212 |
.500 |
|
Problem 3 |
Correlation Coefficient |
|
|
.141 |
.257 |
.249 |
.240 |
.101 |
.000 |
.000 |
.186 |
.202 |
|
|
Sig. (1-tailed) |
|
|
.209 |
.068 |
.075 |
.082 |
.283 |
.500 |
.500 |
.143 |
.122 |
|
Problem 4 |
Correlation Coefficient |
|
|
|
.083 |
-.061 |
.245 |
.586(**) |
-.144 |
.354(*) |
-.066 |
.320(*) |
|
|
Sig. (1-tailed) |
|
|
|
.319 |
.364 |
.078 |
.000 |
.204 |
.019 |
.354 |
.030 |
|
Problem 5 |
Correlation Coefficient |
|
|
|
|
.117 |
.310(*) |
.042 |
-.200 |
.093 |
.139 |
.136 |
|
|
Sig. (1-tailed) |
|
|
|
|
.251 |
.035 |
.405 |
.125 |
.297 |
.213 |
.218 |
|
Problem 6 |
Correlation Coefficient |
|
|
|
|
|
.260 |
-.061 |
.307(*) |
.298(*) |
.245 |
.273 |
|
|
Sig. (1-tailed) |
|
|
|
|
|
.065 |
.363 |
.036 |
.041 |
.078 |
.056 |
|
Problem 7 |
Correlation Coefficient |
|
|
|
|
|
|
.447(**) |
.131 |
.187 |
.253 |
.388(*) |
|
|
Sig. (1-tailed) |
|
|
|
|
|
|
.004 |
.227 |
.141 |
.071 |
.011 |
|
Problem 9 |
Correlation Coefficient |
|
|
|
|
|
|
|
-.123 |
.452(**) |
.182 |
.481(**) |
|
|
Sig. (1-tailed) |
|
|
|
|
|
|
|
.241 |
.003 |
.148 |
.002 |
|
Problem 10 |
Correlation Coefficient |
|
|
|
|
|
|
|
|
.117 |
.038 |
.014 |
|
|
Sig. (1-tailed) |
|
|
|
|
|
|
|
|
.252 |
.414 |
.468 |
|
Problem 11 |
Correlation Coefficient |
|
|
|
|
|
|
|
|
|
.248 |
.531(**) |
|
|
Sig. (1-tailed) |
|
|
|
|
|
|
|
|
|
.076 |
.001 |
|
Problem 12 |
Correlation Coefficient |
|
|
|
|
|
|
|
|
|
|
.345(*) |
|
|
Sig. (1-tailed) |
|
|
|
|
|
|
|
|
|
|
.021 |
* Correlation is significant at the 0.05 level (1-tailed).
** Correlation is significant at the 0.01 level (1-tailed).
Although the study has a small sample size (n=35), the sample is sufficient to test a number of the proposed hypotheses.
Motivation is operationalized using the conscientiousness scale of the BFI. This scale “describes socially prescribed impulse control that facilitates task- and goal-directed behavior, such as thinking before acting, delaying gratification, following norms and rules, and planning, organizing and prioritizing tasks” (John, Naumann, & Soto, 2008, p. 120).
Intuitively, this seems like a critical quality in successful students in general. It is surprising then to discover that this scale does not correlate with academic performance in learning to write computer software and may even negatively correlate with success. This finding contradicts that of Allen and Robbins (2010) who found that motivation did correlate strongly with first-year performance. However, Allen and Robbins defined success as completing a program in the nominal period of the certificate or diploma of study. Using this definition, a student completing a two year diploma in three years would be deemed “unsuccessful.” A number of conjectures are possible to account for this finding: It may be that students who are less conscientious or motivated may still be successful at their course work but take fewer courses per semester of study. Thus their grades per course could still be high but they are delaying the completion of their program. Alternatively, motivation as a personality trait may not be a significant factor in successfully learning to develop computer software.
Comparing students’ preferred learning styles with their academic performance showed no significant correlations. This contradicts previous findings by Thomas et al. who found that reflective and verbal learners became better programmers (2002). That study used a sample of 107 computer science students at the University of Wales. However, this contradiction might be explainable. Academically oriented institutions such as universities and degree granting colleges often rely heavily on lecture based content delivery—the very sort of model that would appeal to students from an abstract, sequential, reflective or verbal oriented learner. Community colleges and institutes of applied learning such as Lethbridge College often utilize a wider variety of pedagogical methodologies and didactic techniques. These practices often use multimedia, group activities, project based learning and problem solving activities—in essence, the very strategies that might resonate with active, visual, random, or global learners—in addition to teaching approaches that may be more favourable to abstract, sequential, reflective or verbal learners.
Balduf reports that almost all students entering a post-secondary institution for the first time were not adequately prepared in terms of study skills, time management abilities and motivation (2009). This finding gave rise to the decision to retest this hypothesis in the current study. In comparing the sample used by Balduf and the current study a number of significant differences emerge: Balduf used as her population, 83 students who were on academic probation from their college, a small degree-granting institution. Only seven students, or 8.6% of this population, agreed to participate in her study. It is possible that, when she chose to interview these subjects, they were more interested in rationalizing their poor academic performance by attributing it to poor time management or lack of preparation by their high school environment. A better referential study is the one conducted by George et al. In this study of a random sample of undergraduate students, a number of personal behaviours and time did correlate with higher GPA.
The fact that the current sample showed no correlation between a self-assessment on time management ability and academic performance may have a number of attributions. It may be that students are not able to effectively assess whether they have good time management skills and strategies. The students in the current study were in the first two weeks of the first semester of their post-secondary program and may not have been in a position yet to assess their time management skills and abilities vis a vis the demands of a post-secondary environment.
If we turn our attention to how students spend their recreational time, we see that, except for volunteerism, the amount of time students spent in any recreational activity was negatively correlated with their sense of time management ability as measured by the 11 question survey. Volunteerism may be an aberration since 26 of the participants reported spending no time volunteering and 7 reported spending between 0 and 2 hours per week. The remaining 2 participants reported spending between 2 and 5 hours and between 10 and 20 hours per week respectively.
While time management is an important factor in academic success, it is a poor predictor of that success. The exception may be computer game playing. Time spent playing computer games correlated very strongly with performance on the first exam (p<0.01) and still showed a strong relationship with academic performance over the entire semester (p@0.062). 6 of the 35 participants reported spending more than 20 hours a week playing computer games. This finding is surprising; anecdotally, many professors can list at least one student who became so involved in computer games that their academic grades suffered. Perhaps those students most passionate about computer games may also be passionate about computer programming—the common thread here being passion around computers and technology. At the same time, it should be noted that time spent on social networking sites was not positively correlated with academic performance. Further work will be required to verify or understand these findings.
The most significant direction to pursue in predicting students’ ability to learn computer programming skills seems to come from the area of assessing problem solving ability. However, not every logical skill or ability is an equally reliable predictor. The pre-study survey included 12 questions related to logical problem solving and critical thinking ability. These tests can be grouped into a number of categories:
|
Gaming Problems |
These are questions in which the thinker is asked to calculate the probability or optimum cost or benefit from a course of action or to be consistent in their calculation of this benefit. |
Problems 1, 3, 5, and 8 |
|
Decision Trees |
The thinker constructs and works through a decision tree that allows the participant to pose the necessary questions to determine the truth of the entire network. These are the Boolean paradigms discussed by Goodwin and Johnson-Laird (2010) or the disjunctive problems identified by Toplak and Stanovich (2002). |
Problems 2, 7, and 10 |
|
Rule Based Deduction |
The thinker applies formal inferential logic, rule based analysis or what Newstead et al. call “Analytical Reasoning” (2006), or basic algebra to solve the problem. |
Problems 4, 6 and 12 |
|
Problem Modeling |
The thinker takes the problem text and envisioning the problem in such a way that a mental model or schema forms that allows them to envision the problem in a new way. They then find the solution almost trivial to solve. |
Problems 9 and 11 |
Among these groups, gaming problems showed no correlation with academic success leading to the conclusion that this is not a type of critical thinking useful to students learning to write computer software.
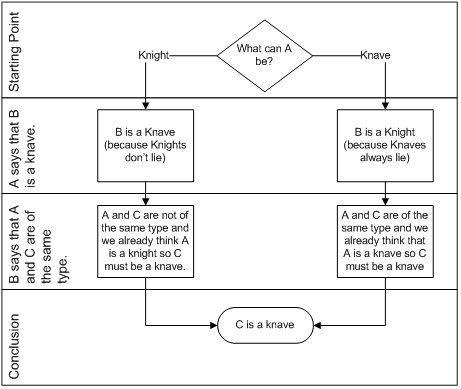
Decision tree problems show more promise. These problems require the thinker to pursue multiple independent analyses of the problem and then see if there is any commonality in the conclusions. For example, the knight vs. knave problem requires the thinker to begin by allowing inhabitant A to be both a knight and a knave (Figure 2). Only by pursuing both decision branches and determining that they both share the same result is a conclusion to the problem possible. This problem was a significant predictor of academic success.
Problems 2 and 10 are also examples of this type of problem but did not show statistical significance. These problems were replicated from Toplak and Stanovich’s study in which the two deductive conclusions were presented but participants were also given the option to claim that no solution was possible (2002). This option was not presented in Problem 7. As a result, 91% of participants chose this option when confronted with problem 2 and 74% chose it as their solution to problem 10. Stanovich, Toplak and West have since referred to this behaviour as “cognitive miserliness,” the phenomenon that when solving a problem becomes “expensive” in terms of cognitive effort, many people give up rather than work out the possible conclusions (2008).
If this option wasn’t presented in these questions, it is likely that participants would have felt forced to work through the problem to the point where they could decide upon a conclusion instead of choosing the cognitively miserly option.
This group of problems is solved by applying the provided or implied rules to arrive at a solution. Their challenge often stems from the thinker’s ability to parse the semantics of the problem, thereby isolating the relevant facts or rules. For example, in problem 12, the floor allocation problem, the thinker would go through each set of rules against the proposed options and discard an option when and if a rule is found to be violated. Similarly problem 4 can be solved using simple algebra but does involve a two part thought process similar to the disjunctive problems. The card problems in question 6 use the rules of logical inference to identify which cards to turn over however these rules may not be as well known to first year students as the rules of algebra. Problem 12 was strongly correlated with academic performance (p=0.021), and problem 4 had a slightly weaker correlation with p=0.03; problem 6 had a much weaker correlation (0.273, p=0.056).
This group of problems provides insufficient rules or information for the thinker to deduce the solution directly. As a result, the thinker must create a mental schema or model which simplifies the problem before solving it. For example, the thinker must start with a mental picture of a pond completely full of lilies (day 48) and then work backwards to understand that it will be half-full one day earlier. This sort of cognitive hinting is not present in the problem text but is the only way to solve this problem. Similarly, solving the widget problem using algebra is too intensive for many people; the most efficient way to solve this problem is for the thinker to picture a group of five machines each turning out a widget every five minutes, and then realizing that each of a hundred machines would still take five minutes to turn out a widget. Both these problems were very significant (p<0.01) in their correlation with academic performance, indicating that this sort of thinking is critical to success in learning computer programming.
From the current study, it appears that personality traits as measured by the Big Five Inventory, and learning styles measured by the Index of Learning Styles are poor predictors of future academic success for students in an introductory computer programming course.
Surprisingly, time management practices and self-assessment do not seem to be good predictors of academic success either. Is it possible that computer science students either “get it” or they don’t without a considerable amount of time spent studying the topic?
There are a number of possible explanations for our results. The small sample size of this study may be a factor, and a more broadly based study with a larger sample size may find significance in the future. This study also operationally defined academic performance as the students’ results on midterm and final exams. In reality, instructional methods in computer science programs almost invariably involve completing large and complex programming assignments and projects that are not trivial in their time requirements. It is possible for some students to do well on an exam without much study or preparation but if they do not have the time management ability and skill to apply themselves to their programming projects, their final marks and GPA will suffer. Furthermore, using the time management survey with students in other programs of study might provide useful insights into whether time management ability among IT students is somehow fundamentally different from the ability of students in other programs, or whether this survey is fundamentally flawed in its attempt to measure this variable. However, there is some indication that the passion that students feel for computers in general—whether that passion is realized in playing games or developing software—may be a predictor of success in computer software courses.
A better class of predictor involves understanding how students solve logical problems. However, not all logical problems seem to be equally useful in this regard.
Many logical problems ask participants to evaluate the best of available options. These “gaming” paradigm questions are a class of disjunctive reasoning problems that require participants to explicitly or implicitly compute the probability of various outcomes. Participants are expected to make the choice the results in the most reward (usually money) with the least amount of risk. Participants are then given some latitude on how much risk they are prepared to accept for an expected amount of reward. The goal of these problems is to determine if the respondents are consistent in their assessment of risk and reward. These problems show little to no relevance to the ability of students to acquire computer programming skills.
The decision tree class of disjunctive reasoning problems is more interesting to analyze. Although only one of the three problems of this class shows statistical relevance, this might be explainable using Toplak and Stanovich’s (2002) concept of “cognitive miserliness” in which thinkers will often take a pass on a complicated problem if such an option is presented to them. Only 5 subjects in the current study did not chose option “c”, “cannot be determined”, for question 2 and only 12 subjects did not chose this option for question 10. Toplak and Stanovich would consider the remaining subjects to be “cognitive misers” who did not want to spend the time to work through this problem and instead took the pass provided. Among those students who were not cognitive misers, all students correctly solved problem 2 and 75% correctly solved problem 10. If option c was not available to students, students would be forced to work through the decision tree of these problems. This in turn might increase the predictive power of these problems.
Rule based problems showed much more promise in their ability to predict academic success. Problem 12 strongly correlated with success yet could easily be solved by simply applying the rules to the scenarios and then rejecting those scenarios which violated any of the supplied rules. As such, the correlation of this problem may be an indicator of the students’ ability to semantically parse and understand the problem rather than the student’s reasonability ability in itself. Similarly, question 4 can be solved using basic algebra provided the student can adequately parse the problem text and understand what he or she is to solve. Problem 6 requires an understanding of logical inference, however many IT and CS students have not been exposed to logical deduction by the time they enter their first semester programming class. This may explain why this problem was a poor predictor of academic success: many students did not adequately understand the rules upon which this problem was based and thus even an adequate parsing of the problem text was not sufficient to allow them to apply the rules to solve the problem as they understood it.
The best predictor of success seems to be those problems which require students to both reason disjunctively and envision the problem in an iterative or sequential way. Students with this ability seem to be able to understand how to apply loops and other control structures within software programming such that each iteration through a loop or each decision through a problem will bring the problem closer to its resolution.
Future work in this area may be best served by creating an inventory of problem-modeling, decision tree, and rule-based problems of various complexities and then testing this inventory against new intake students in programs of computer science and information technology. Rule-based problems must be constructed with the expectation that once students can correctly parse the problem text, they will be competent in applying the rules required to solve the problem.
Evaluation of curricula and teaching methodologies at the secondary educational level are also warranted. Curricula modifications in primary and secondary educational systems to support students in develop these logical and critical thinking skills at an earlier age could better prepare students for a future career in the Information and Communication Technology industry.
Allen, J., & Robbins, S. (2010). Effects of Interest-Major Congruence, Motivation, and Academic Performance on Timely Degree Attainment. Journal of Counseling Psychology , 57 (1), 23-35.
Balduf, M. (2009). Underachievement among College Students. Journal of Advanced Academics , 20 (2), 274-294.
Bayman, P., & Mayer, R. (1988). Using Conceptual Models to Teach BASIC Computer Programming. Journal of Educational Psychology , 80 (3), 291-298.
Canadian Broadcasting Corporation. (2010, February 26). IT dropouts adding to worker shortage. Retrieved May 21, 2010, from CBC News: http://www.cbc.ca/canada/prince-edward-island/story/2010/02/26/pei-it-worker-dropout-584.html [24]
Davidson, G., & Saveyne, W. (1992). How do learning styles relate to performance in a computer applications course? Journal of Research on Computing in Education , 24 (3), 348-357.
Frederick, S. (2005). Cognitive Reflection and Decision Making. The Journal of Economic Perspectives , 19 (4), 25-42.
George, D., Dixon, S., Stansal, E., Gelb, S., & Pheri, T. (2008). Time Diary and Questionnaire Assessment of Factors Associated with Academic and Personal Success Among University Undergraduates. Journal of American College Health , 56 (6), 706-715.
Goodwin, G., & Johnson-Laird, P. (2010). Conceptual Illusions. Cognition , 114, 253-265.
Gregorc, A. (1984). Style as a Symptom: A Phenomenological Perspective. Theory into Practice , 23 (1), 51-55.
Information and Communications Technology Council. (2008, October). Outlook for Human Resources in the Information and Communications Technology Labour Market, 2008 to 2015: Final Report. Retrieved September 20, 2009, from Information and Communications Technology Council: http://www.ictc-ctic.ca/en/Content.aspx?id=2055 [25]
John, O., Naumann, L., & Soto, C. (2008). Paradigm Shift to the Integrative Big Five Trait Taxonomy: History, Measurement, and Conceptual Issues. In O. John, R. Robins, & L. Pervin (Eds.), Handbook of Personality: Theory and Research (pp. 114-158). New York, NY, USA: Guilford Press.
Komarraju, M., & Karau, S. (2005). The relationship between the big five personality traits and academic motivation. Personality and Individual Differences , 39, 557-567.
Le, H., Casillas, A., Robbins, S., & Langley, R. (2005). Motivational and Skills, Social, and Self-Management Predictors of College Outcomes: Constructing the Student Readiness Inventory. Educational and Psychological Measurement , 65 (3), 482.
Newstead, S., Bradon, P., Handley, S., Dennis, I., & Evans, J. (2006). Predicting the Difficulty of Complex Logical Reasoning Problems. Thinking and Reasoning , 12 (1), 62-90.
Peterson, C., Casillas, A., & Robbins, S. (2006). The Student Readiness Inventory and the Big Five: Examining Social Desirability and College Academic Performance. Personality and Individual Differences , 41, 663-673.
Slonim, J., Scully, S., & McAlliser, M. (2008, October). Crossroads for Canadian CS enrollment. Communications of the ACM , 51 (10), pp. 66-70.
Soloman, B., & Felder, R. (2009). Index of Learning Styles Questionnaire. Retrieved September 20, 2009, from College of Engineering, North Carolina State University: http://www.engr.ncsu.edu/learningstyles/ilsweb.html [26]
Stanovich, K. (2002). Rationality, Intelligence, and Levels of Analysis in Cognitive Science: Is Dysrationalia Possible? In R. Sternberg (Ed.), Why Smart People Can be so Stupid (pp. 124-158). New Haven, CT: Yale University Press.
Stanovich, K., Toplak, M., & West, R. (2008). The Development of Rational Thought: A Taxonomy of Heuristics and Biases. In R. Kail (Ed.), Advances in Child Development and Behavior (Vol. 36). San Diego, CA: Academic Press.
Thomas, L., Ratcliffe, M., Woodburry, J., & Jarman, E. (2002). Learning styles and performance in the introductory programming sequence. Technical Symposium on Computer Science Education: Proceedings of the 33rd SIGCSE technical symposium on Computer science education (pp. 33-37). Covington, Kentucky: ACM.
Toplak, M., & Stanovich, K. (2002). The Domain Specificity and Generality of Disjunctive Reasoning: Searching for a Generalizable Critical Thinking Skill. Journal of Educational Psychology , 94 (1), 197-209.
Links
[1] https://niedermayer.ca/user/login?destination=node/100%23comment-form
[2] https://niedermayer.ca/user/login?destination=node/101%23comment-form
[3] https://niedermayer.ca/user/login?destination=node/102%23comment-form
[4] https://niedermayer.ca/user/login?destination=node/103%23comment-form
[5] https://niedermayer.ca/user/login?destination=node/104%23comment-form
[6] https://niedermayer.ca/user/login?destination=node/105%23comment-form
[7] https://niedermayer.ca/user/login?destination=node/106%23comment-form
[8] https://niedermayer.ca/user/login?destination=node/107%23comment-form
[9] https://niedermayer.ca/user/login?destination=node/108%23comment-form
[10] https://niedermayer.ca/user/login?destination=node/109%23comment-form
[11] https://niedermayer.ca/user/login?destination=node/110%23comment-form
[12] https://niedermayer.ca/user/login?destination=node/111%23comment-form
[13] https://niedermayer.ca/user/login?destination=node/112%23comment-form
[14] https://niedermayer.ca/user/login?destination=node/113%23comment-form
[15] https://niedermayer.ca/user/login?destination=node/114%23comment-form
[16] https://niedermayer.ca/user/login?destination=node/115%23comment-form
[17] https://niedermayer.ca/user/login?destination=node/116%23comment-form
[18] https://niedermayer.ca/user/login?destination=node/117%23comment-form
[19] https://niedermayer.ca/user/login?destination=node/118%23comment-form
[20] https://niedermayer.ca/user/login?destination=node/119%23comment-form
[21] https://niedermayer.ca/user/login?destination=node/120%23comment-form
[22] https://niedermayer.ca/user/login?destination=node/121%23comment-form
[23] https://niedermayer.ca/user/login?destination=node/122%23comment-form
[24] http://www.cbc.ca/canada/prince-edward-island/story/2010/02/26/pei-it-worker-dropout-584.html
[25] http://www.ictc-ctic.ca/en/Content.aspx?id=2055
[26] http://www.engr.ncsu.edu/learningstyles/ilsweb.html
[27] https://niedermayer.ca/user/login?destination=node/123%23comment-form