

Out of 457 responses, 38.5% stated that they had a computer and 50% of these households have modems. An additional 10.7% of respondents are planning to purchase a computer within 2 years. Based on people's intentions, within two years, over 68% of home computers will be accompanied with modems.
An additional 7.4% of respondents stated that they do not own computers and have no immediate intention of purchasing one, but are interested in using public terminals to access the Free-Net. As well 51% of those who either own or are planning to own computers are also interested in public access terminals in libraries and other public places.
For the remainder of the study, 235 completed full forms were used for the analysis.
In total over 37% of respondents will have the hardware to access the Free-Net or are interested in using public access terminals.
| Table 1: Computer and Modem ownership and future ownership as a percentage of total sample. | ||
|---|---|---|
| % of Total | Cum. % | |
| Have computer | 38.5 | 38.5 |
| Plan to purchase computer | 5.5 | 44.0 |
| Have modem | 19.3 | 19.3 |
| Plan to purchase modem | 10.7 | 30.0 |
| Table 2: Interest in using public access terminals among those with or planning to buy home computers and those with no plan to own a home computer | ||
|---|---|---|
| % of Total | Cum. % | |
| Own or plan to buy a computer | 24.7 | 24.7 |
| No plan to own a computer | 7.4 | 32.1 |
From the 51% of respondents who have a computer, plan to purchase a computer or want to have access via public terminals, the following demographic profiles emerged. Among educational levels, high school graduates and those with Bachelor's degrees emerged as two groups with the greatest likelihood of having a computer. Most computer users are between 25 and 44 years of age. More than half (51.4%) had three to four members in their household. When asked for their language of preference 97.5% responded with English while the remaining 2.5% gave no response or otherwise refused to answer. Most users have a household income over $35,000 per annum and 59.7% were male.
At the same time, these results must be prefaced with the caution that some sub-groups in this study are under-represented. Of those respondents who have a computer and modem, or who are planning on acquiring one, or who are interested in public access terminals, Tables 3-6 portrays the size (n) of these sub-groups relative to the total study. Where n is very small, results relevant to these sub-groups must be interpreted with the greatest of latitude.
| Table 3: Frequency (n) and percentage of each sub-group relative to the total sample size by gender | ||
|---|---|---|
| n | Percent | |
| Male | 114 | 48.5 |
| Female | 76 | 32.3 |
| Undetermined | 45 | 19.1 |
| Table 4: Frequency (n) and percentage of each sub-group relative to the total sample size by age | ||
|---|---|---|
| n | Percent | |
| 13-17 | 25 | 10.6 |
| 18-24 | 26 | 11.1 |
| 25-34 | 45 | 19.1 |
| 35-44 | 65 | 27.7 |
| 45-54 | 24 | 10.2 |
| 55-64 | 8 | 3.4 |
| 65-75 | 5 | 2.1 |
| over 75 | 0 | 0.0 |
| Don't Know/Refused | 37 | 15.7 |
| Table 5: Frequency (n) and percentage of each sub-group relative to the total sample size by highest achieved educational level | ||
|---|---|---|
| n | Percent | |
| less than High School | 24 | 10.2 |
| High School Diploma | 48 | 20.4 |
| some Univ./Tech. | 33 | 14.0 |
| Technical Diploma | 21 | 8.9 |
| Bachelors Degree | 50 | 21.3 |
| Graduate Degree | 21 | 8.9 |
| Refused /Don't Know | 38 | 16.2 |
| Table 6: Frequency (n) and percentage of each sub-group relative to the total sample size by household size | ||
|---|---|---|
| n | Percent | |
| One | 20 | 8.5 |
| Two | 41 | 17.4 |
| Three-Four | 105 | 44.7 |
| Five or more | 31 | 13.2 |
| Refused/Don't Know | 38 | 16.2 |
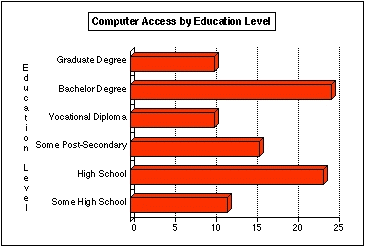 Figure 3: Percent of respondents who have a home computer and modem or who want to access the Free-Net via public terminals stratified by highest achieved education level.
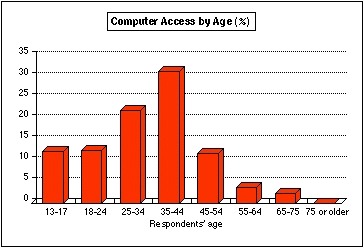 Figure 4: Percent of respondents who have a home computer and modem or who want to access the Free-Net via public terminals as referenced by age.
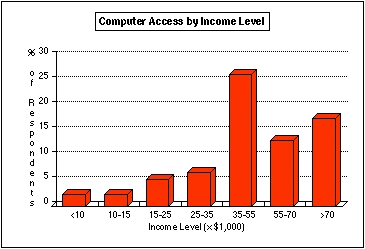 Figure 5: Percent of respondents who have a home computer and modem or who want to access the Free-Net via public terminals as referenced by income level.
Respondents were also asked to rank their interest in various content categories using a Likert-type scale. These responses were then cross-tabulated against demographic variables.
Both men and women share similar interests in many respects. Computer information and advice, library catalogs, community information, educational programs, recreational schedules, reference materials, health information, e-mail, news, travel planning, conversation, weather information, financial information, show tickets and information, and government reports and information are ranked as very or slightly important by more than half of all respondents regardless of gender.
Some gender differences do emerge. Women are more likely than men to express an interest in community information, health information, travel planning, club and society information, self-help groups as well as UIC and the Job Bank. Men are more likely than women to express interest in long-distance shopping, agricultural information, financial information and sporting issues.
Overall, both genders seem unenthusiastic about shopping and merchandising activities in general, as well as "niche" groups such as professional associations, UIC and self-help groups.
When grouped by age, all age brackets are generally interested in library catalogs, health, computer and community information. The majority of 13-54 year olds are interested in e-mail, travel, reference materials, educational programs (distance education), conversation on-line, and news. Only a minority of respondents in the older age groups of 55 are interested in these categories.
Youth (13-17) are unanimous in their support for sports information on-line. Younger people in general are interested in both the educational and recreational opportunities afforded by a Free-Net. Younger people are more interested in using the Free-Net for consumer and commercial activities. Young adults are also very interested in the use of the Free-Net as a forum for job hunting, and to a lesser extent, government publications and financial planning and information.
Individuals with technical institute certificates and diplomas are generally unenthusiastic about the opportunities afforded by Free-Nets. As shown in Figure 8, they often express the lowest interest in many information categories.
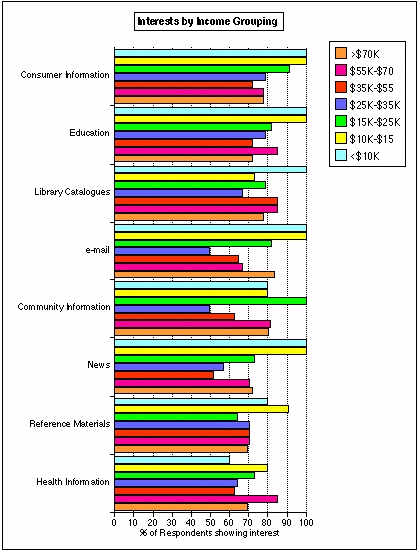
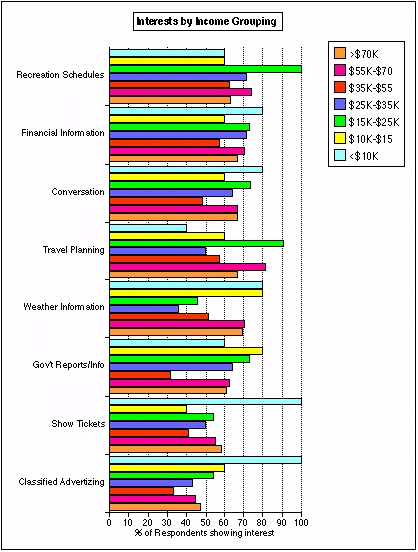
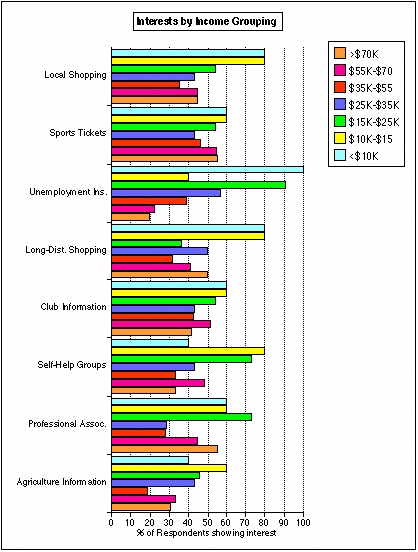
Those respondents at the lower income levels generally express a stronger interest for most information categories including educational, recreational, informational and news resources as well as e-mail. There is a strong desire among low and middle income brackets to use Free-Net resources for job searching, and a desire among low income respondents to use the Free-Net for shopping purposes.
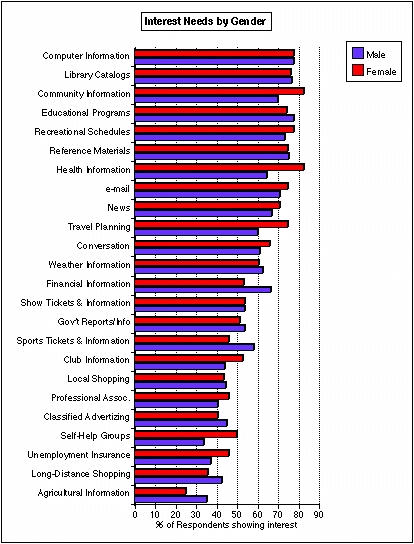 Figure 6: Percent of Respondents who are "Very Interested" or "Somewhat Interested" in various content areas as stratified by gender.
Figure 7.1: Percent of Respondents who are "Very Interested" or "Somewhat Interested" in various content areas as stratified by age. 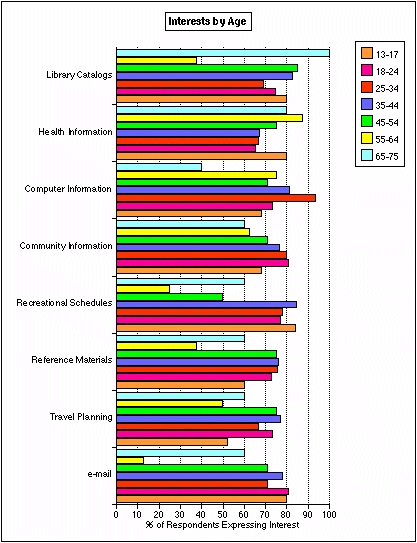
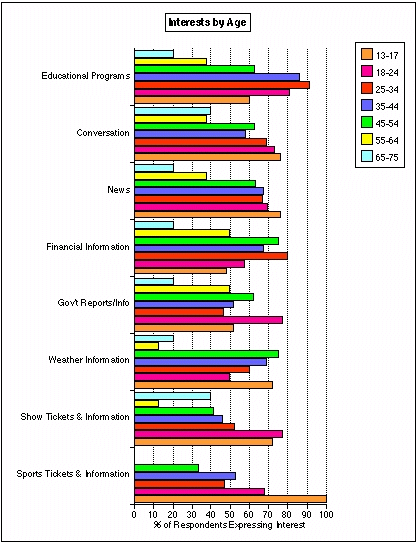
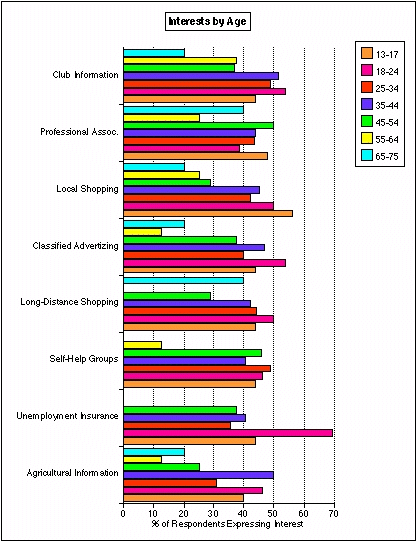
Figure 8.1: Percent of Respondents who are "Very Interested" or "Somewhat Interested" in various content areas as stratified by highest achieved educational level. 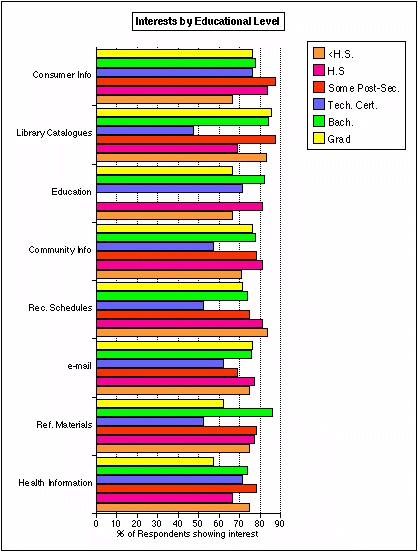
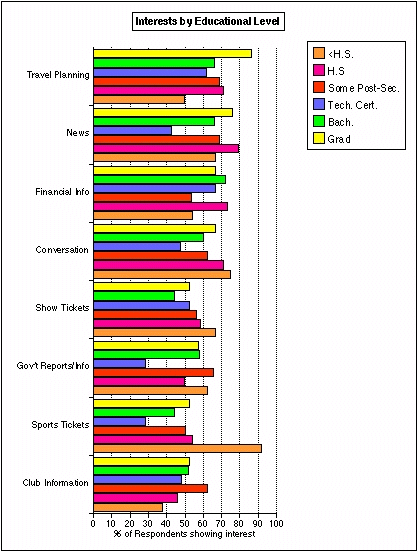
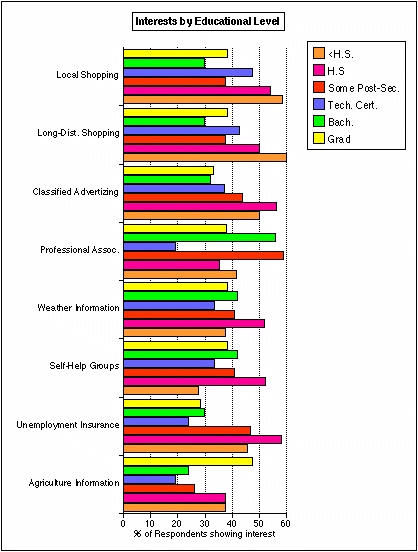
Figure 9.1: Percent of Respondents who are "Very Interested" or "Somewhat Interested" in various content areas as stratified by income groupings.
Although most people (60.5%) said they had never heard of the Free-Net prior to the survey, a broad spectrum of support for the Free-Net emerged from the data. Among all education levels, the majority of respondents stated that they were interested in using the Free-Net (Figure 10). Except those with technical certificates or diplomas, more than 81% of people in all educational levels showed their support of the Free-Net concept. Among people with technical certificates support was only 67%.
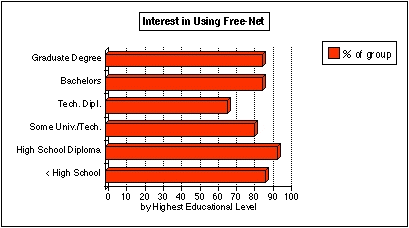
Figure 10: Percent of respondents from each educational level who expressed an interest in using the Free-Net (excluding "no" and "don't know" responses).
The same high level of support was found among all age groups under 55. Support in all age categories from 13 to 54 for use of the Free-Net ranged in to 84-92% range. Only in the 55-64 and 64-75 age groups did a minority of respondents express an interest in using the Free-Net.
Among the lower income groups, less that $10,000 household income and $10,000-15,000, the level of support was 100%. Among higher income groups is ranged from 78% to 93%.
When sorted by gender, males were more interested in using the Free-Net than females. 90.3% of men expressed such an interest compared to 73.7% of females.
People do seem prepared to back up this interest with their pocketbooks. When asked what they thought was a fair annual donation, 25% of respondents suggested a donation in the $50-100 range. Another 20% felt that $25-49 was an appropriate range. Over half of respondents felt that an annual donation above $25 was a fair one. As well, 53% of respondents said that they were willing to make such a donation. Only 15% said "No" when asked, "Would you be willing to make a donation to help cover the operating expenses of the Free-Net?".
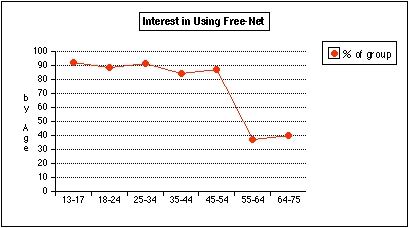
Figure 11: Percent of respondents from each age level who expressed an interest in using the Free-Net (excluding "no" and "don't know" responses).
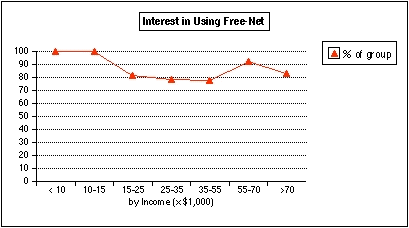
Figure 12: Percent of respondents from each household income level who expressed an interest in using the Free-Net (excluding "no" and "don't know" responses).
26% of respondents already have Internet access, Of these, 32% have access from home, 55% from work, and 28% through school[6]. People who have current Internet access through home, work or school are even more willing to access the Free-Net. 95% of these people stated their interest in using the Free-Net compared with only 76% of people without Internet access. People who have access through home or school were unanimous in their support for the Free-Net while 90% of the people who connected through work felt they would use the Free-Net.
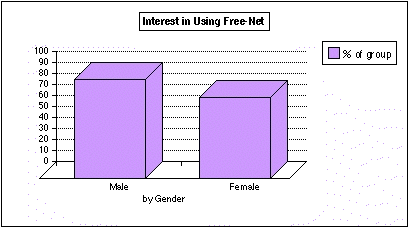 Figure 13: Percent of respondents by gender who expressed an interest in using the Free-Net (excluding "no" and "don't know" responses).
Both those with and without Internet access were about as likely to give a donation to the Free-Net (65% for those with access compared to 60%) but people with Internet access were generally prepared to give a slightly larger donation. Internet users were more likely to become members of the Free-Net (45.6% compared to 33.6%), and felt that larger membership fees were in order (57.7% felt fees above $25 were in order, compared to 39% for those without access). People with current access were slightly more prepared to volunteer time to the Free-Net (37% compared to 31%).
Among those with only e-mail access (20% of those with Internet access), 100% were interested in using the Free-Net, but were less likely to give a donation (58.3% compared to 69.4%). Full access users were also more likely to take out membership (55.6% compared with 41.7%). Those with less access were also much 60.5more undecided about their responses.
Growth of the Free-Net movement depends on community involvement. 32.3%--almost a third of respondents said that they were interested in becoming a member. 69% of these people felt that a membership fee of between $10 and $49 was appropriate with numbers evenly split between the $10-24 range and $25-49. As well, 28.2% indicated their interest in volunteering time to help with the Free-Net.
22% of respondents claimed they had heard of the Great Plains Free-Net before the survey. Most of these obtained their knowledge through the newspaper, friends and colleagues, and in the workplace.
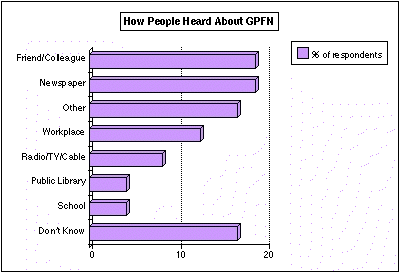 Figure 14: Relative sources of knowledge among those respondents who are familiar with the Great Plains Free-Net.
[6]Numbers do not add up to 100 because some individuals have access from more than one location.
Of those households which have a computer and modem, less than a third have speeds under 14.4 kilobaud. Users saw themselves logging on between 2-4 times a month and daily.
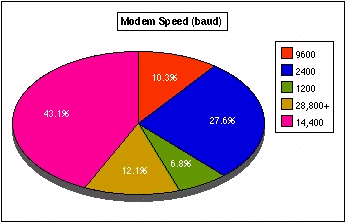 Figure 15: Maximum modem transmission rates among those respondents who know the speed of their modem.
48% of respondents stated that they saw themselves logging onto the system in the early evening (6-9PM) with a much smaller group (11.4%) looking forward to late evening (9-11PM). Early afternoon (12-3PM) was the least likely time for logons (1.4%). 21.8% did not know or gave no response as to their preferred logon times.
Respondents saw themselves logging on weekdays (28.6%) or all days equally (30.0%). Saturdays were preferred by 12.7% while Sundays were only favoured by 5% of respondents.
Most people felt a maximum access time of 30 minutes to 2 hours was a fair length of time for registered users.
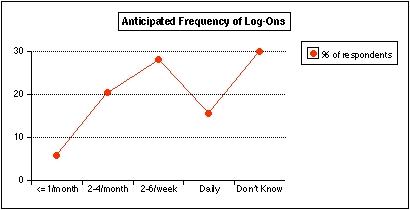 Figure 16: Anticipated frequency of logons to the GPFN system among those users who said they would become registered users.
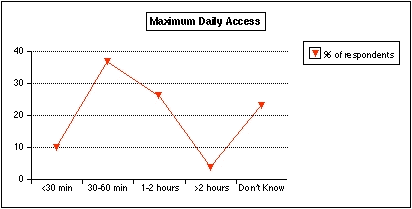 Figure 17: Desired maximum daily access among those respondents who said they would become GPFN registered users.
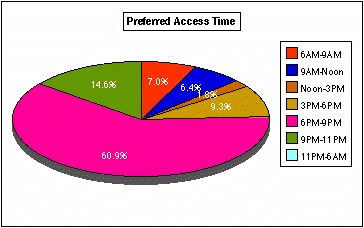 Figure 18: Preferred time to day for logging onto the system.
Links
[1] https://niedermayer.ca/user/login?destination=node/214%23comment-form
[2] https://niedermayer.ca/user/login?destination=node/215%23comment-form
[3] https://niedermayer.ca/user/login?destination=node/216%23comment-form
[4] https://niedermayer.ca/user/login?destination=node/217%23comment-form